A quadrant report is a visual tool used to compare and analyze data across two dimensions. In the context of student performance between two assessments or exams.
The criteria for dividing student performance into quadrants. Typically, this involves establishing thresholds for high and low performance in both assessments.
Collect Data: Gather the scores of students from the two assessments exams.
Plot Data: Create a scatter plot with one assessment score on the x-axis and the other assessment score on the y-axis. Each point on the plot represents a student’s performance in both assessments.
Divide Quadrants: Using the thresholds defined in step 1, divide the plot into four quadrants:
- Quadrant I: High performance in both assessments.
- Quadrant II: High performance in the first assessment, but low performance in the second assessment.
- Quadrant III: Low performance in both assessments.
- Quadrant IV: Low performance in the first assessment, but high performance in the second assessment.
Analyze Results: Examine the distribution of students across the quadrants to gain insights into patterns of performance. This analysis can help identify trends such as students who consistently perform well or poorly across assessments, as well as those who show improvement or decline between assessments.
Take Action: Use the insights gained from the quadrant report to inform instructional strategies, interventions, or additional support for students as needed.
Here’s a simple example of what a quadrant report might look like:
A quadrant report comparing internal assessment (such as classroom tests or assignments) and external assessment (such as standardized tests or exams) can indeed help identify students whose performance differs significantly between these two types of assessments. Let’s create a quadrant report based on this scenario:
External Assessment (x-axis)
Internal Assessment (y-axis)
Student 1
- External : 8
- Internal 60
Student 2
- External 3
- Internal 90
Now, let’s plot these points on a quadrant report:
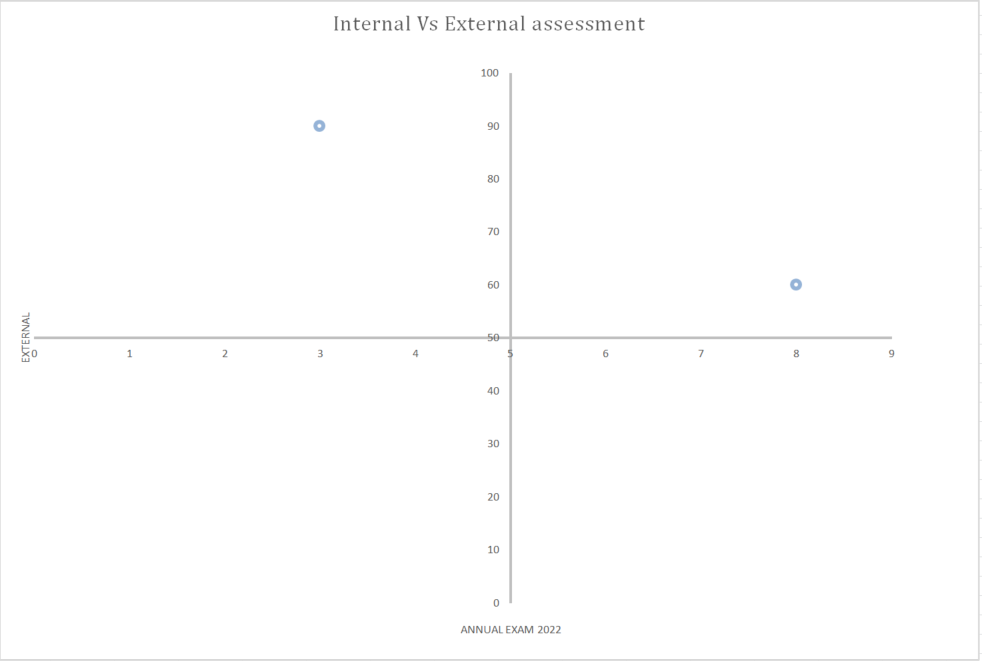
In this example:
- Student 1 scored 8 in the external assessment and 60 in the internal assessment, placing them in the high-high quadrant (Quadrant I).
- Student 2 scored 3 in the external assessment and 90 in the internal assessment, placing them in the low-high quadrant (Quadrant II).
From this quadrant report, educators can observe that Student 1’s performance remains consistently high across both internal and external assessments. However, Student 2 scored low on the External but high on the Internal assessment
This significant difference may prompt further investigation into the reasons behind Student 2’s discrepancy in performance between internal and external assessments, leading to targeted support or adjustments in teaching strategies.
Path: Student > Examination > Reports > Quadrant Report
- Select Academic session
- Select class/section, term, and assessment.
- Select subject
- Click on submit, and the report will be downloaded with a graphical view.