A Quadrant Report is a chart that quickly sorts students into four groups based on their performance in two different assessments (for example, periodic test & mid term exams). This visual summary makes it easy to see which students are excelling, need support, or show mixed results.
How to generate a Quadrant Report?
- Go to Student > Examination > Examination Report > Quadrant Report
- Apply the relevant filters, such as class, subject, or assessment.
- Click Submit to view or download the report.
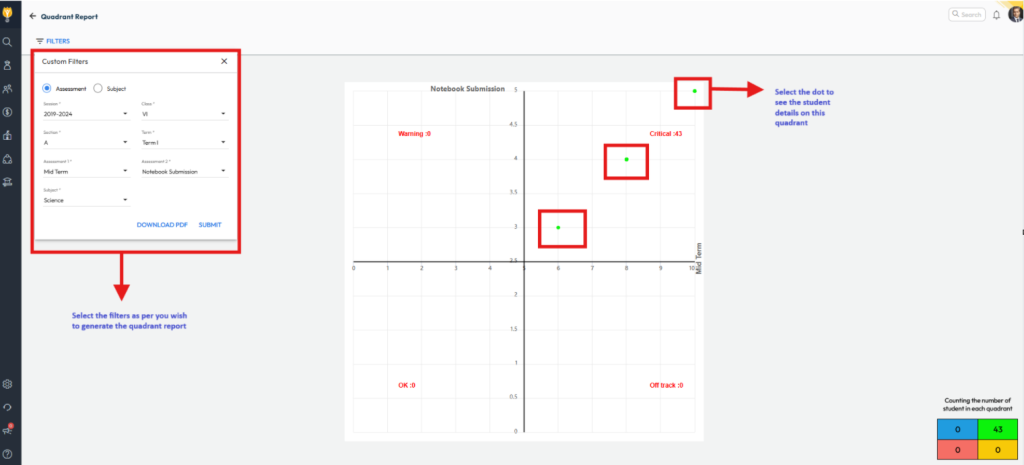
How to use the report?
The Quadrant Report plots student scores on a graph, using one assessment score for the x-axis and another for the y-axis
The chart splits students into four boxes:
- Top right(Quadrant I) : High scores in both assessments
- Top left(Quadrant II) : High in first, lower in second
- Bottom right(Quadrant III) : Low in first, higher in second
- Bottom left(Quadrant IV) : Low scores in both
This makes it easy to spot students who always do well, those who need extra help, and those who might be improving or declining.
Tip : Teachers can use this chart to focus help where it’s needed most, track progress, and adjust teaching plans.
Video Tutorial :
Was this article helpful to you?
Yes0
No0